Root Cause Analysis


Fishbone Diagram
What is it?
Why use it?
- Identifies multiple potential causes to be analyzed.
- Identifies potential areas to make changes to cause change in output.
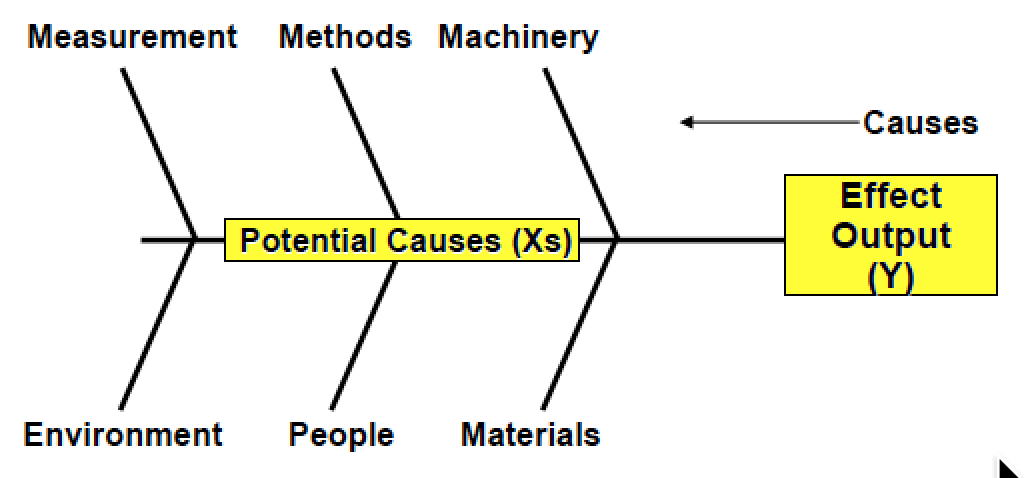
Fishbone – Construction
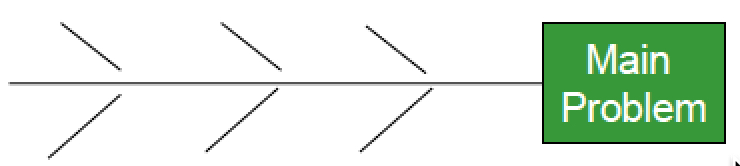
- Draw the Fishbone
- Write the problem in the box. Be sure everyone agrees.
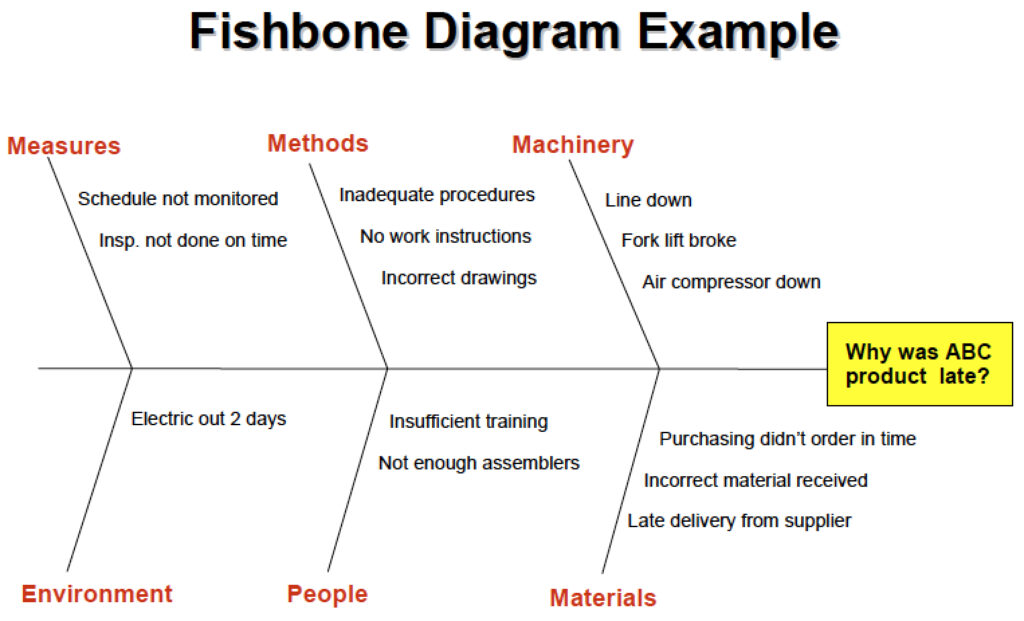
- Label each of the “Bones”: People, Machines, Methods, Materials, Measurement, Environment, Policies, Procedures, Plant; or whatever labels are appropriate.
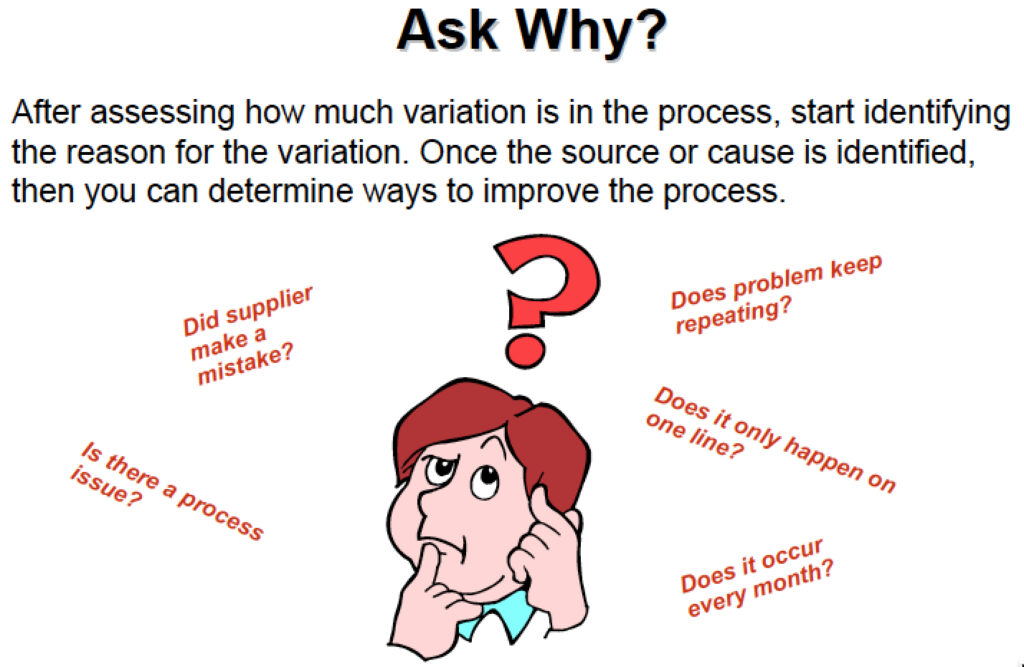
- Brainstorm all the potential causes in each label. Ask “Why” repeatedly.
- Plan the data collection process to identify actual causes not possible causes.
Caution – Try to stay with problems that are within the control of the group to be sure you can take action to improve.
Cause & Effect Diagram Tips
Do:
- Use Brainstorming techniques to do Cause & Effect Diagrams.
- Write down All ideas.
- Expands the branches out until you have identified all potential causes.
- Utilize input from personnel from every area involved in the process, e.g. Operators, Maintenance, Technical, IT, Sales, Engineering.
- Display the Cause & Effect Diagram where other people who are part of the process and solicit their input.
- As a group, select the 3-5 most likely causes and the obtain additional data to determine which of these causes is the root cause of the problem. May need to look at other cause not selected the first time.
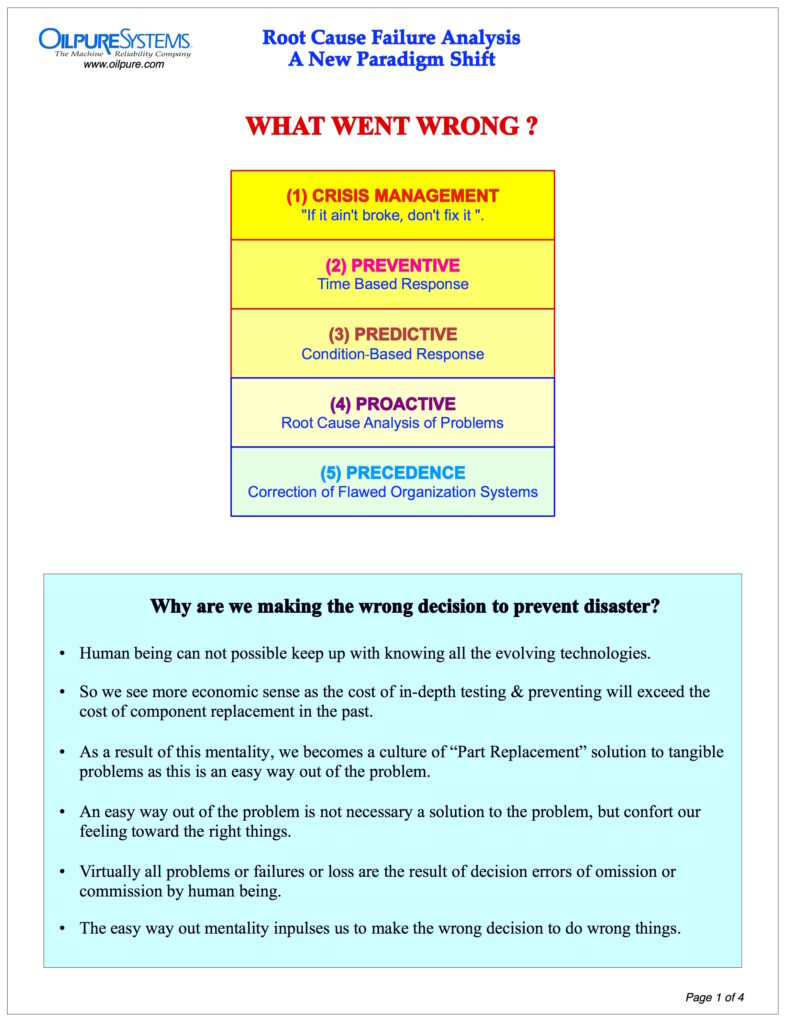
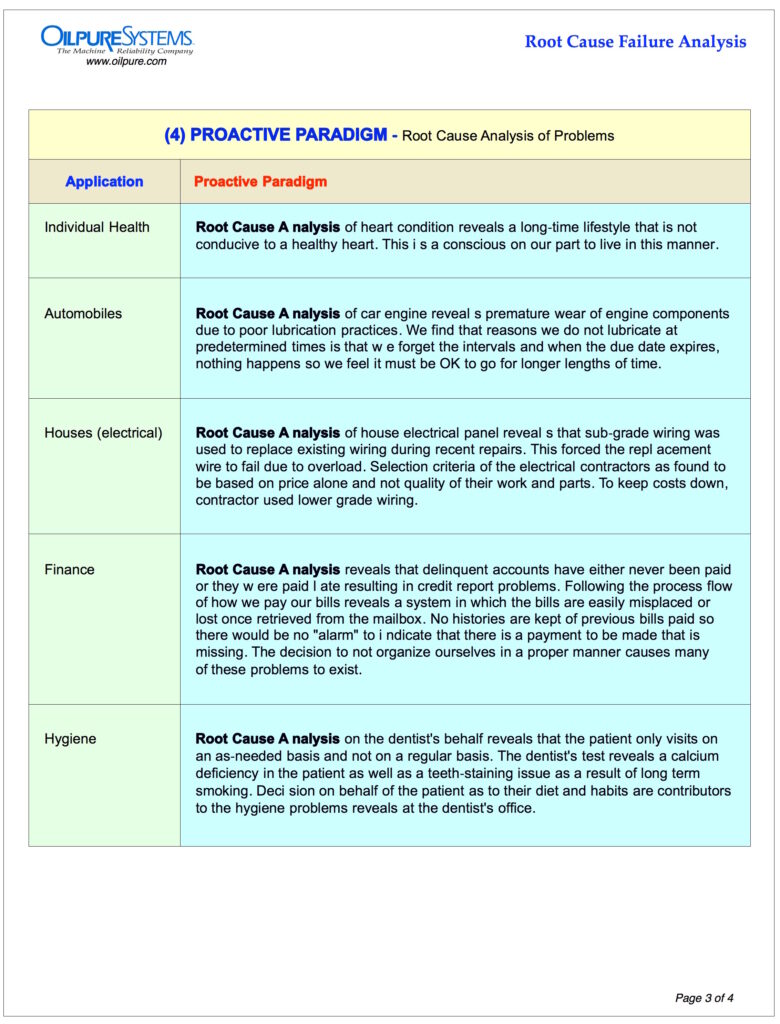
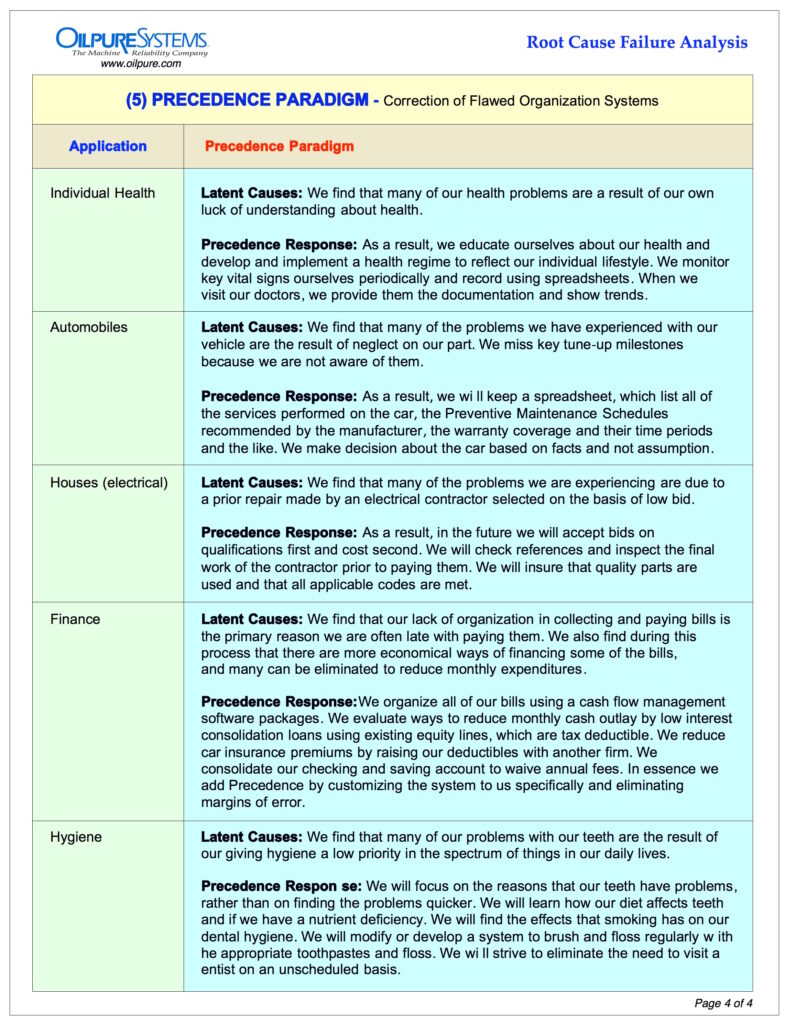
Root Cause Failure Analysis – A New Paradigm Shift
© Copyright, August , 2021
Document and information in this website is a proprietary information belonging to OilPure and is not allowed to reveal to public without OilPure consent.